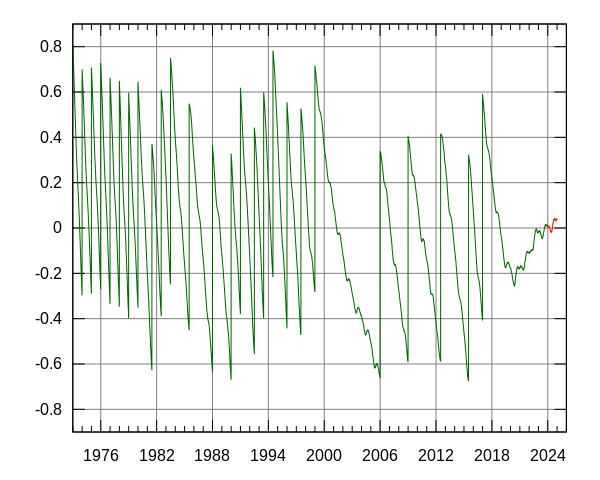
File:Leapsecond.ut1-utc.svg
外观

此SVG文件的PNG预览的大小:600 × 480像素。 其他分辨率:300 × 240像素 | 960 × 768像素 | 1,280 × 1,024像素 | 2,560 × 2,048像素。
原始文件 (SVG文件,尺寸为600 × 480像素,文件大小:305 KB)
文件历史
点击某个日期/时间查看对应时刻的文件。
| 日期/时间 | 缩略图 | 大小 | 用户 | 备注 | |
|---|---|---|---|---|---|
| 当前 | 2024年7月4日 (四) 20:29 |  | 600 × 480(305 KB) | RP88 | Updated to use data available as of 2024-07-04. Updated to use gunplot 6.0. |
| 2024年1月3日 (三) 02:57 |  | 600 × 480(301 KB) | RP88 | Updated to use data available as of 2024-01-03. Prediction through 2025. | |
| 2023年8月4日 (五) 03:17 |  | 600 × 480(298 KB) | RP88 | Updated to use data available as of 2023-08-03. Prediction through 2024. | |
| 2022年9月30日 (五) 15:17 |  | 600 × 480(246 KB) | Mormegil | updated to current data | |
| 2022年4月1日 (五) 08:59 |  | 600 × 480(242 KB) | Mormegil | updated to current data | |
| 2021年1月4日 (一) 09:02 |  | 600 × 480(238 KB) | Mormegil | updated to current data | |
| 2020年4月29日 (三) 08:16 |  | 600 × 480(235 KB) | Mormegil | update data | |
| 2019年9月24日 (二) 14:00 |  | 600 × 480(234 KB) | Mormegil | updated to current data with prediction until 2020-09 | |
| 2019年1月23日 (三) 10:46 |  | 600 × 480(231 KB) | Mormegil | updated to current data | |
| 2018年8月13日 (一) 07:47 |  | 600 × 480(229 KB) | Mormegil | updated to current data |
文件用途
以下页面使用本文件:
全域文件用途
以下其他wiki使用此文件:
- ar.wikipedia.org上的用途
- azb.wikipedia.org上的用途
- be.wikipedia.org上的用途
- ca.wikipedia.org上的用途
- cs.wikipedia.org上的用途
- da.wikipedia.org上的用途
- el.wikipedia.org上的用途
- en.wikipedia.org上的用途
- es.wikipedia.org上的用途
- et.wikipedia.org上的用途
- fi.wikipedia.org上的用途
- fr.wikipedia.org上的用途
- he.wikipedia.org上的用途
- hr.wikipedia.org上的用途
- hu.wikipedia.org上的用途
- it.wikipedia.org上的用途
- ja.wikipedia.org上的用途
- ko.wikipedia.org上的用途
- lv.wikipedia.org上的用途
- ms.wikipedia.org上的用途
- no.wikipedia.org上的用途
- pl.wikipedia.org上的用途
- pt.wikipedia.org上的用途
- ru.wikipedia.org上的用途
- sd.wikipedia.org上的用途
- sh.wikipedia.org上的用途
- sk.wikipedia.org上的用途
- sr.wikipedia.org上的用途
- th.wikipedia.org上的用途
- uk.wikipedia.org上的用途
- ur.wikipedia.org上的用途
- www.wikidata.org上的用途
- zgh.wikipedia.org上的用途
- zh-yue.wikipedia.org上的用途


