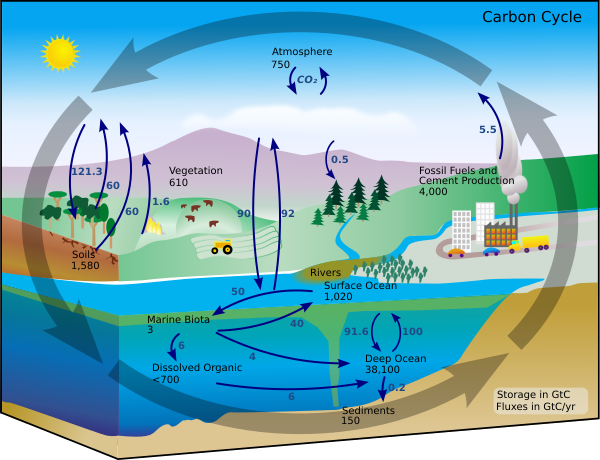
File:Carbon cycle-cute diagram.svg
外观

此SVG文件的PNG预览的大小:600 × 460像素。 其他分辨率:313 × 240像素 | 626 × 480像素 | 1,002 × 768像素 | 1,280 × 981像素 | 2,560 × 1,963像素。
原始文件 (SVG文件,尺寸为600 × 460像素,文件大小:65 KB)
文件历史
点击某个日期/时间查看对应时刻的文件。
| 日期/时间 | 缩略图 | 大小 | 用户 | 备注 | |
|---|---|---|---|---|---|
| 当前 | 2024年4月1日 (一) 20:26 |  | 600 × 460(65 KB) | Pko | Reverted to version as of 10:00, 8 September 2021 (UTC) |
| 2021年12月12日 (日) 13:26 |  | 600 × 460(79 KB) | Pko | File uploaded using svgtranslate tool (https://svgtranslate.toolforge.org/). Added translation for pl. | |
| 2021年9月8日 (三) 10:00 |  | 600 × 460(65 KB) | Pavouk | fix small error | |
| 2021年9月8日 (三) 09:53 |  | 600 × 460(65 KB) | Pavouk | add Czech labels (correct numbers) | |
| 2021年8月28日 (六) 07:04 |  | 600 × 460(65 KB) | Sarang | Version cleaned from toolforge-translator failures (222 W3C errors), structured: now easy to add more languages using a text editor | |
| 2021年8月19日 (四) 18:40 |  | 512 × 393(88 KB) | Glrx | add systemLanguage="vi" in Dissolved Organic switch // Editing SVG source code using c:User:Rillke/SVGedit.js | |
| 2021年4月21日 (三) 01:52 |  | 512 × 393(88 KB) | Tttrung | add Vietnamese translation | |
| 2021年2月19日 (五) 17:12 |  | 512 × 393(85 KB) | YoaR | File uploaded using svgtranslate tool (https://svgtranslate.toolforge.org/). Added translation for ast. | |
| 2020年8月8日 (六) 11:40 |  | 512 × 393(80 KB) | Persia | File uploaded using svgtranslate tool (https://svgtranslate.toolforge.org/). Added translation for fa. | |
| 2020年7月24日 (五) 09:05 |  | 512 × 393(62 KB) | Sarang | The TOOLFORGE translations since 2020-07-08 generated 696 ID attributes, with 52 not-unique occurrencies = 52 W3C errors. The code is now cleaned from that garbage of ID and tspan. Please do not use buggy tools like Toolforge again! Insert new languages with a text editor. |
文件用途
全域文件用途
以下其他wiki使用此文件:
- af.wikipedia.org上的用途
- ami.wikipedia.org上的用途
- ar.wikipedia.org上的用途
- ast.wikipedia.org上的用途
- as.wikipedia.org上的用途
- az.wikipedia.org上的用途
- beta.wikiversity.org上的用途
- bg.wikipedia.org上的用途
- bs.wikipedia.org上的用途
- cs.wikipedia.org上的用途
- da.wikipedia.org上的用途
- de.wikipedia.org上的用途
- de.wikibooks.org上的用途
- el.wikipedia.org上的用途
- en.wikipedia.org上的用途
- Carbon
- Natural capital
- Carbon cycle
- Environmental economics
- Ecological economics
- Kerogen
- Primary production
- Biological pump
- Urban ecology
- Biogeochemical cycle
- C4 carbon fixation
- Photorespiration
- Solubility pump
- Continental shelf pump
- Dissolved inorganic carbon
- Total organic carbon
- Carbonate compensation depth
- Redfield ratio
- Carbon-based life
- Black carbon
查看此文件的更多全域用途。


